Exploratory Data Analysis
Initial Analysis and Visualizations
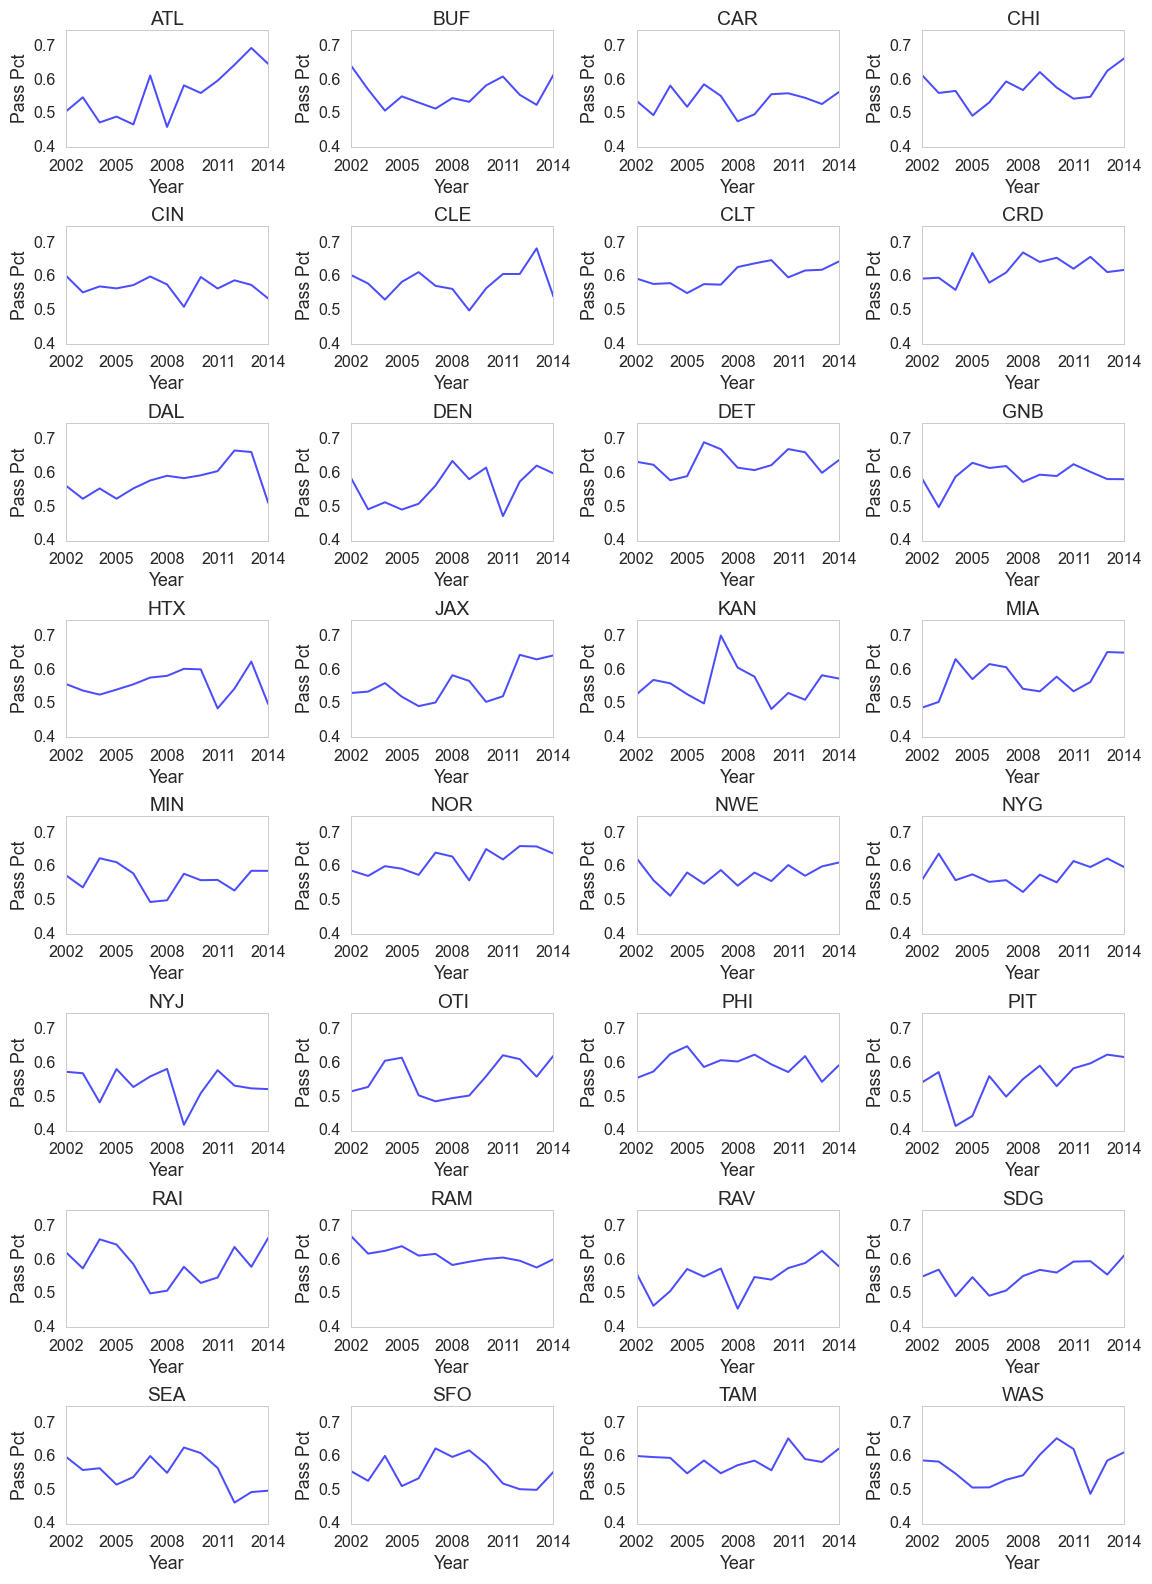
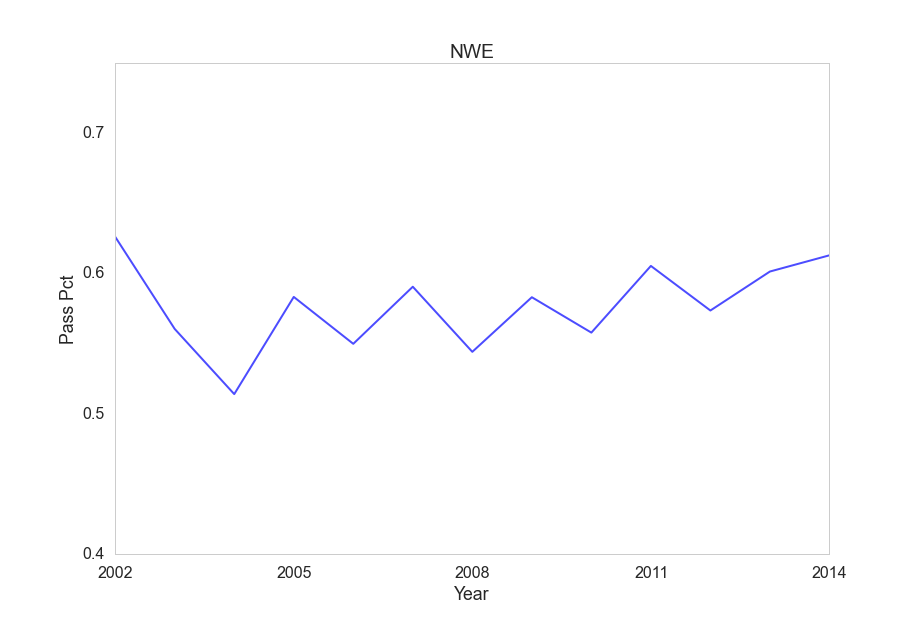
One of the first features we considered for our model was a team’s prior passing percentage, since we expected pass-heavy teams to be more likely to pass on a play than run-heavy teams. Therefore, one of the first things we wanted to visualize was what this passing percentage looks like for each team and how it changes over time. The following plot shows this information.
Passing Percentages Over Time by Team
These plots also match up with what we might expect to see. Take the following few plots, for example:
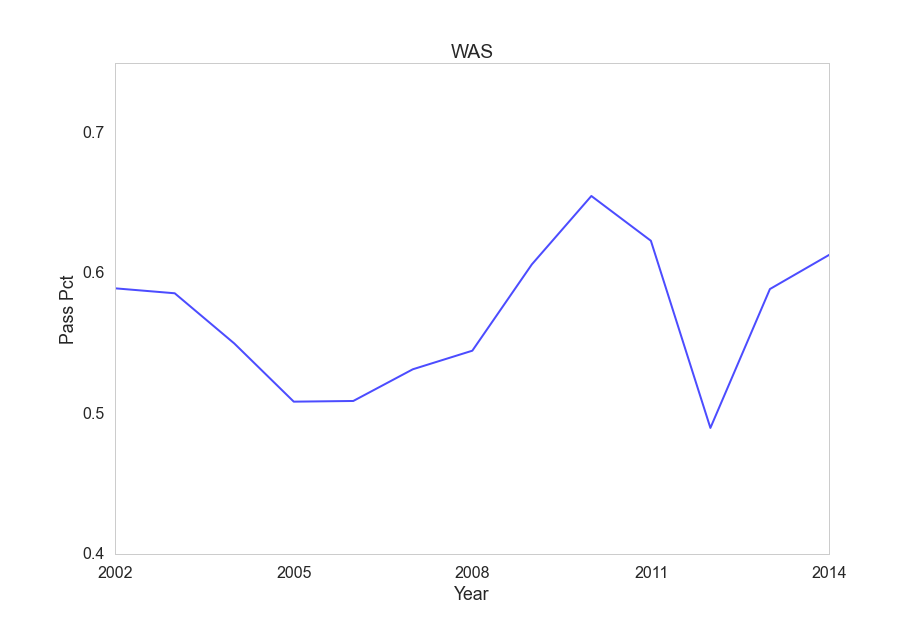
Washington Redskins
In 2012, with the arrival of rookie RG3, the Redskins switched to a much more run-based offense, and we can see this in the plot.
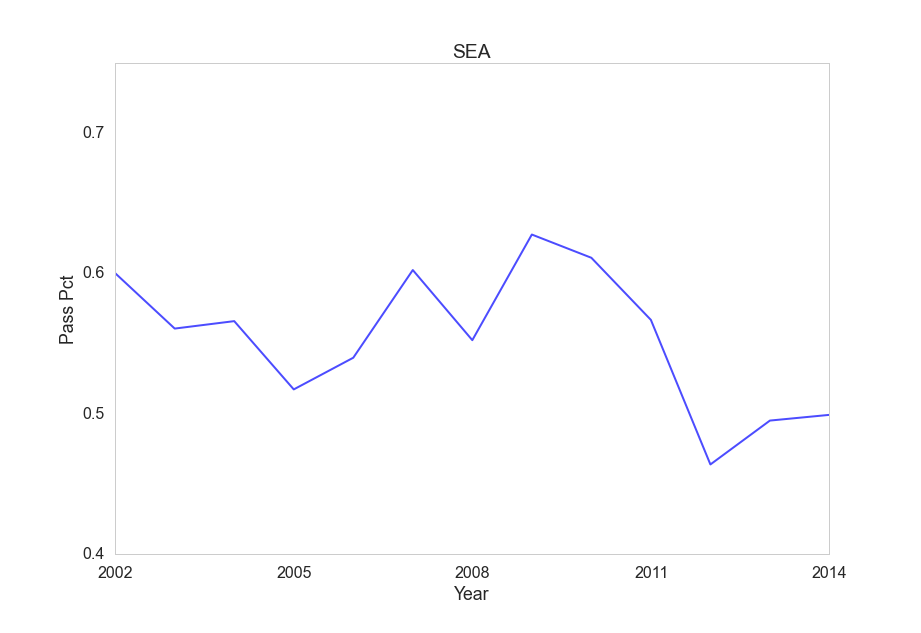
Seattle Seahawks
Similarly, Russell Wilson’s arrival in Seattle in 2012 led to a decrease in passing, and we can also see that here.
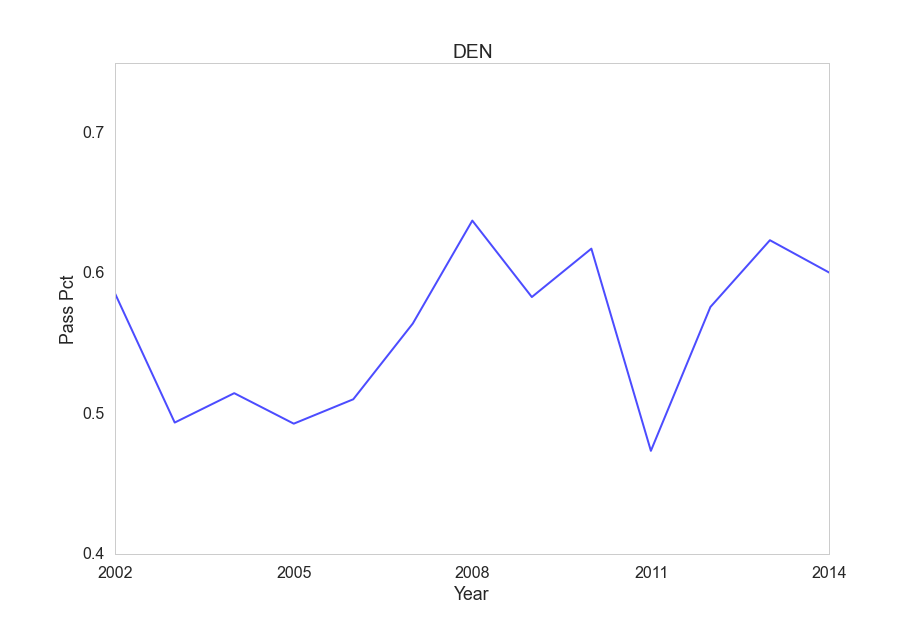
Denver Broncos
The Broncos’ offense was similarly impacted in 2011 by the change to the more mobile quarterback Tim Tebow, as the spike on the plot shows.
New England Patriots
Directional Breakdown
We were also interested in exploring depth/direction of passes and direction of rushes, so we looked at a few teams’ breakdowns in this regard. A few examples of these plots are below.
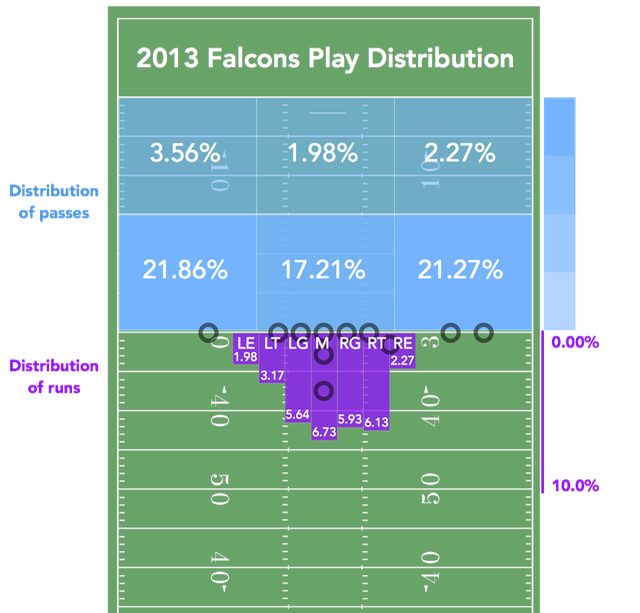
2013 Atlanta Falcons
Here we can see that the 2013 Falcons, one of the most pass-heavy teams in recent years, were running a lot of short passes.
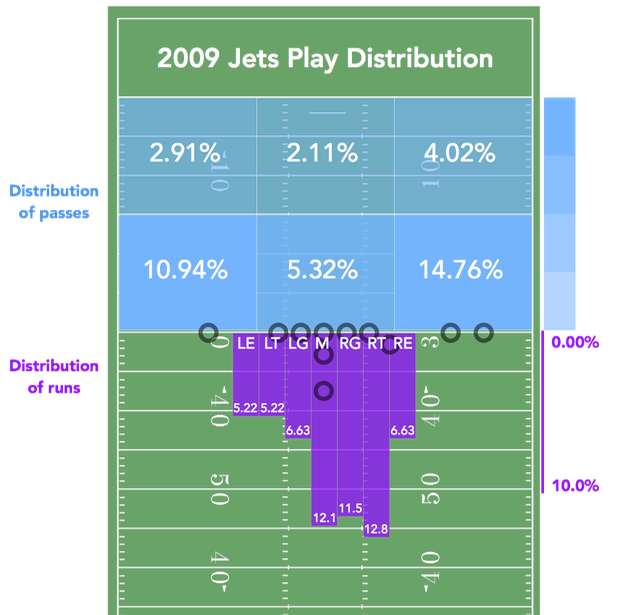
2009 New York Jets
The 2009 Jets, one of the most rush-heavy teams in our data set, called fewer passes, especially shorter ones, and opted for a lot of runs instead, especially runs to the right.
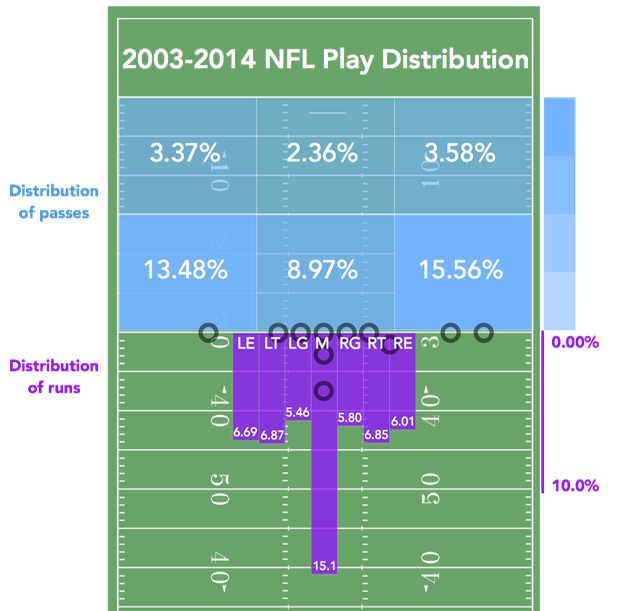
Combined NFL
Here we can see the overall breakdown for the league, which gives a useful baseline. We can also see that the directional breakdown is fairly symmetric.
Play Breakdown Throughout the Game
Another point of interest is how the breakdown of plays changes over the course of a game. Intuitively, we expected to see different playcalling within the last 2-3 minutes of a half than at the beginning of a half, since the time remaining in a half tends to change a team’s gameplan. To investigate this, we looked at the following plots.
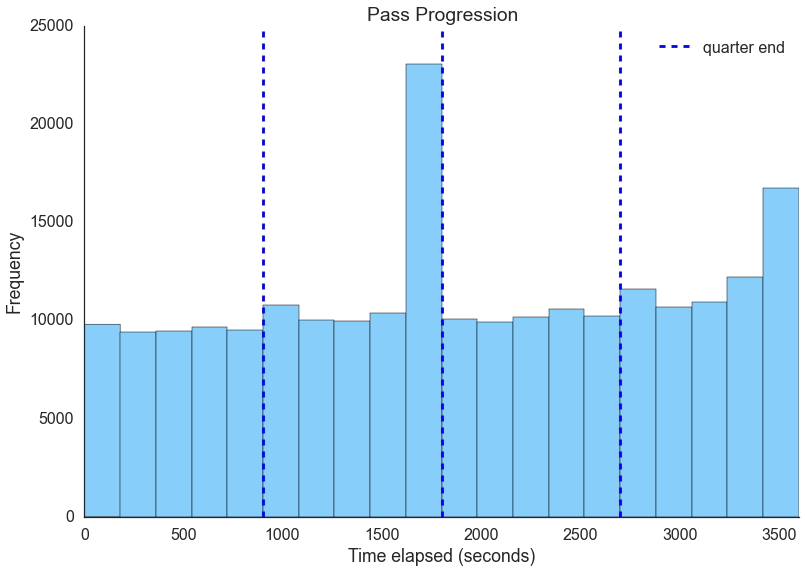
Passing Breakdown
Here we can see that teams tend to pass more right before the end of the halves, which makes sense, as teams try to conserve time and move down the field before the break.
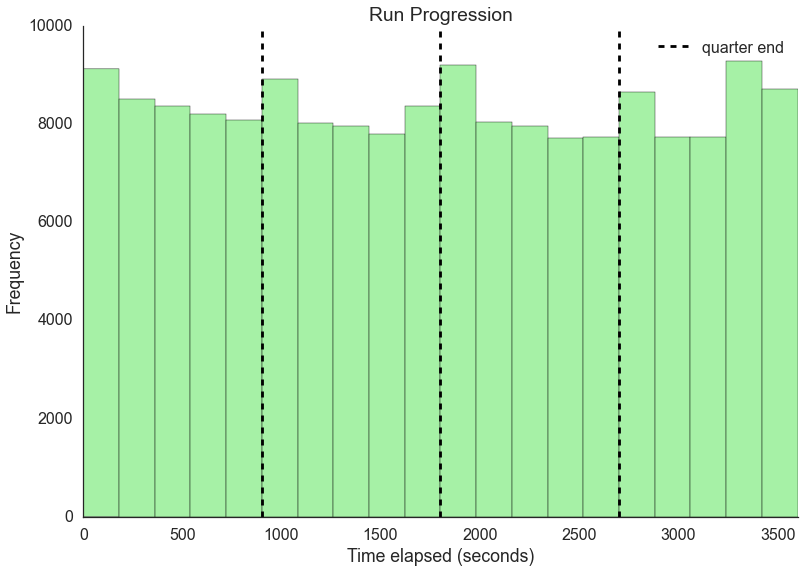
Rushing Breakdown
Here, we see that teams tend to get their ground game going at the start of a quarter before scaling it back, and there’s an increase at the end of the game, probably from teams running out the clock.
Passing Percentage by Down
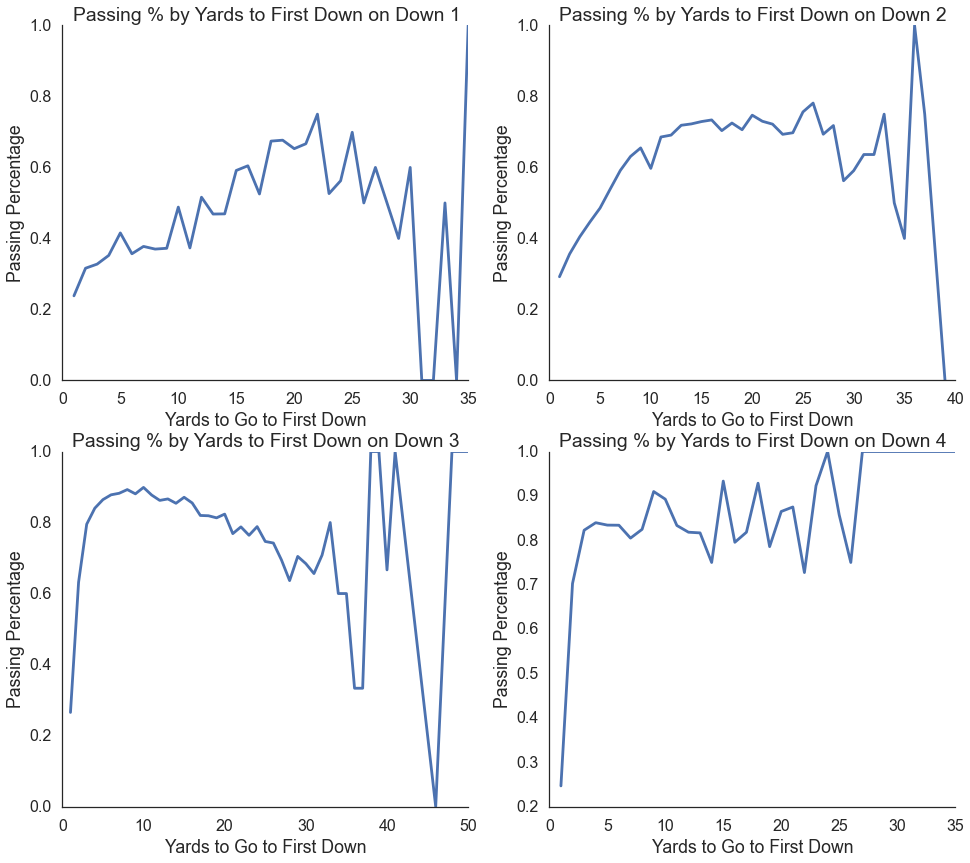
These plots show some fairly intuitive ideas. For example, teams tend to pass less on first down, but pass more if they have longer distances. Conversely, on third and fourth downs, when a conversion is more important, teams are more likely to pass, especially in longer yardage situations.